myDBR enables you to generate various types of charts based on your data. For comprehensive documentation on charts, please refer to the Charts section. In this example, we will create a sample pie chart.
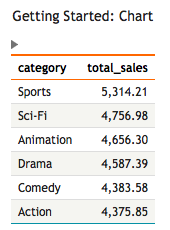
As in the previous examples, we'll generate a stored report to produce the report and the data needed for the chart. In the case of a pie chart, we need a category and value column. We'll create a sample Pie-chart illustrating the total sales of film categories. The procedure to be created looks like this:
create procedure sp_DBR_FilmByCategoryChart()
begin

select category, total_sales
from mydb.sales_by_film_category;

end
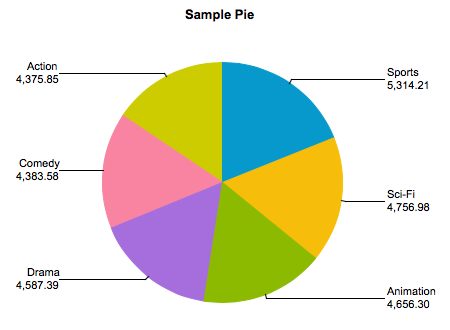
After assigning the procedure to myDBR and running it, we'll obtain the data required for the chart. The first parameter is the chart type ('pie'), and the second is an optional chart name. You can also specify the chart size or use any available options.
A dbr.chart -command is added in front of the result set to generate a chart.
create procedure sp_DBR_FilmByCategoryChart()
begin

select 'dbr.chart', 'Pie', 'Sample Pie chart';

select category, total_sales
from mydb.sales_by_film_category;

end
We'll get the data drawn as a chart when we re-run the report.
For complete documentation on charts see the Charts and Graphviz section.