Table reports
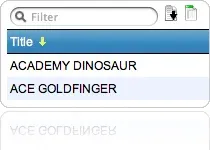
By default, myDBR displays data as a table report. Table reports are simple elements that show the data in tabular form. Users can sort, filter, and page the data in the table.

myDBR is a web-based reporting system designed for relational databases, offering a manageable and scalable reporting environment. By building on the database system’s existing features, such as stored procedures, myDBR lets authors create reports with familiar tools and be productive from day one. The reporting features, including subtotals, formatting, charts, and layout, can be enabled quickly with a single line of code. Users access the system with a standard web browser, and clients need no additional software.
myDBR automatically creates report layouts, eliminating the often time-consuming process of designing them by hand. Using metadata taken directly from the database system, myDBR generates the layout and formats the report data automatically. This enables the report author to focus entirely on the business logic. Automatic layouts also make fully dynamic reports possible, where the structure of the report changes with the data.
myDBR’s rich feature set is designed to enhance your productivity.
By default, myDBR displays data as a table report. Table reports are simple elements that show the data in tabular form. Users can sort, filter, and page the data in the table.
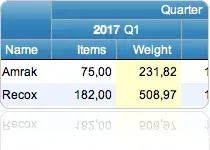
In a crosstable report, myDBR turns the table report into a crosstable. Crosstable reports are ideal for turning sequential data into a readable format.
Creating a crosstable requires only one command.
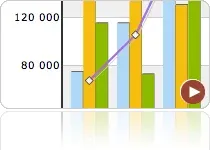
myDBR includes extensive charting capabilities for visualizing data. Charts can easily be transposed without complex query changes.
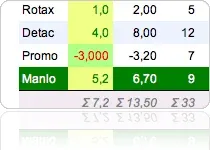
myDBR automatically formats your data based on the data content and selected theme.
On top of this, you can use global styles to format individual elements in the reports.
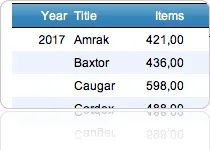
With grouping, you can organize tabular reports by defining breakpoints in the data.
Grouping can have multiple levels, making summary rows easy to create.
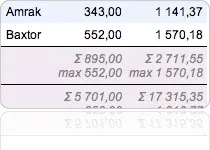
Want to add an aggregate calculation to a report column? Use myDBR’s powerful aggregate functionality to handle the calculations for you.
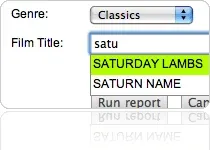
myDBR automatically detects which report parameters to ask the user for and offers a suitable template for each one.
User parameters can be assigned to pop-ups, radio buttons, and AJAX autocomplete fields, with default values.

With myDBR, you can link any external data that a browser can access into the report.
Include images from your product catalog or embed your latest Google spreadsheet.
Your choice.

myDBR lets users export data for further processing.
Reports can be exported to various formats (Excel, PDF, XML, CSV, SQL, JSON, etc.).
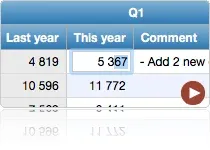
myDBR offers full editing capability for your data. You can create full-featured web applications or simply let users edit specific data. The same report can be read-only for some users while allowing others to edit the data.
myDBR creates layouts for you automatically. If you want a specific layout, you can use myDBR’s template system. Report maintenance is easy because the layout and the report logic are kept separate.

With myDBR’s scheduling feature, you can run periodic reports automatically. Run database maintenance scripts, send reports by email, or push mobile notifications.
Download the free Community version, or explore the live demo first.