Collapsing Mutiple 2D Columns into a single Multi Series ?

(8 posts) (2 voices)

Tags:

No tags yet.

  1. loydb, Member

    Newbie here.

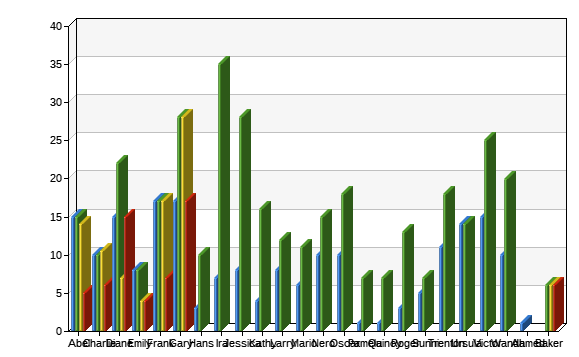
    What I want to do is create a single Multi Series, but I'm not sure how to properly query this. This example pulls two different pieces of data out of our answers table for each customer. I'd like to have them side-by-side in a Multi Series chart, but I have only managed to get them each into their own regular chart. Can this be done? Thanks!

    SELECT 'dbr.chart', 'Column3D', 'Years in Role';

    select
    c.alias as 'Alias',
    a.response as 'Years in Role'
    from
    research.customers c
    join
    research.answers a on a.customerID = c.ID
    where
    a.questionID = 5
    order by
    c.alias;

    SELECT 'dbr.chart', 'Column3D', 'Years in IT';

    select
    c.alias as 'Alias',
    a.response as 'Years in IT'
    from
    research.customers c
    join
    research.answers a on a.customerID = c.ID
    where
    a.questionID = 7
    order by
    c.alias;

  2. myDBR Team, Key Master

    A multiseries chart has format of:

    select Category, SeriesName, SeriesValue
    from mydb.Data;

    As your queries are the same, you can get away with single query:

    select 'dbr.chart', 'MSColumn3D';
    
    select c.alias, if (a.questionID=5, 'Years in Role', 'Years in IT'),  a.response
    from research.customers c
    join research.answers a on a.customerID = c.ID
    where a.questionID in (5,7);

    If your queries where different, you would just use an union to combine the result sets.

    --
    myDBR Team

  3. loydb, Member

    Ok, that makes sense. Thanks!

  4. loydb, Member

    To follow up on this, I've now got it showing the 4 bars I want for each user. Is there a way to make this spread out wider? I tried the autoscale_x option with no luck. I don't see an equivalent for each item to the 'bargap' and 'subbargap' options (I was hoping for 'itemgap' or the like). I realize this would probably break printing, but these are being consumed web-based.

    Thanks!

  5. myDBR Team, Key Master

    If you have a fixed number of items in x-axis, you can just make the chart wider.

    If you have variable number of items in x-axis, set the x-size of the chart 'auto' and set the width of individual x-axis series with 'width_per_item'-option.

    select 'dbr.chart', 'MSColumn3D', '', 'auto';
    select 'dbr.chart.options', 'width_per_item', 90;

    --
    myDBR Team

  6. loydb, Member

    That just sets the chart name to 'auto'.
    select 'dbr.chart', 'MSColumn3D', 'auto'; select 'dbr.chart.options', 'autoscale_x'; select 'dbr.chart.options', 'width_per_item', 90;
    No change, either with or without the 'autoscale_x' line.

  7. myDBR Team, Key Master

    Minor correction. The third parameter for dbr.chart is the title.

    select 'dbr.chart', 'MSColumn3D', '', 'auto';
    select 'dbr.chart.options', 'width_per_item', 90;

    --
    myDBR Team

  8. loydb, Member

    Much better! Thanks.


Reply

You must log in to post.