Creating Your First Chart
myDBR allows you to generate various types of charts based on your data. For comprehensive documentation on charts, please refer to the Charts section. In this example, we will create a sample pie chart.
Generating a Chart
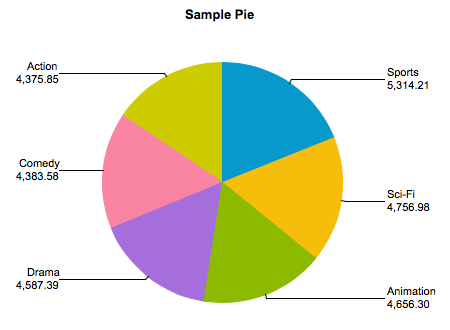
As in the previous examples, we will create a stored procedure to generate the report and the data required for the chart. A pie chart requires a category column and a value column. We will create a sample pie chart illustrating the total sales of film categories. The procedure looks like this:
create procedure sp_DBR_FilmByCategoryChart()
begin

select category, total_sales
from mydb.sales_by_film_category;

end
After registering the procedure in myDBR and running it, we obtain the raw data. To transform this data into a chart, we use the dbr.chart command. Its first parameter specifies the chart type ('Pie'), and the second is an optional chart title. You can also define the chart dimensions and other configuration options.

The dbr.chart command is placed before the result set to generate the chart:
create procedure sp_DBR_FilmByCategoryChart()
begin

select 'dbr.chart', 'Pie', 'Sample Pie chart';

select category, total_sales
from mydb.sales_by_film_category;

end
When you re-run the report, the data will be rendered as a chart.
For complete documentation on charts, refer to the Charts section.