D3 Extension
d3 extension is a framework for the D3 JavaScript library.
Commands
dbr.d3 - Creates a D3 object
dbr.d3.sankey_format - Formats Sankey diagram tooltips
dbr.d3.zoom - Adjusts the zoom level for Chord diagrams when labels are long
Syntax
select 'dbr.d3', 'chart_type'
select 'dbr.d3.sankey_format', 'd3_numeric_format', 'number_suffix'...
select 'dbr.d3.zoom', pixels
Usage
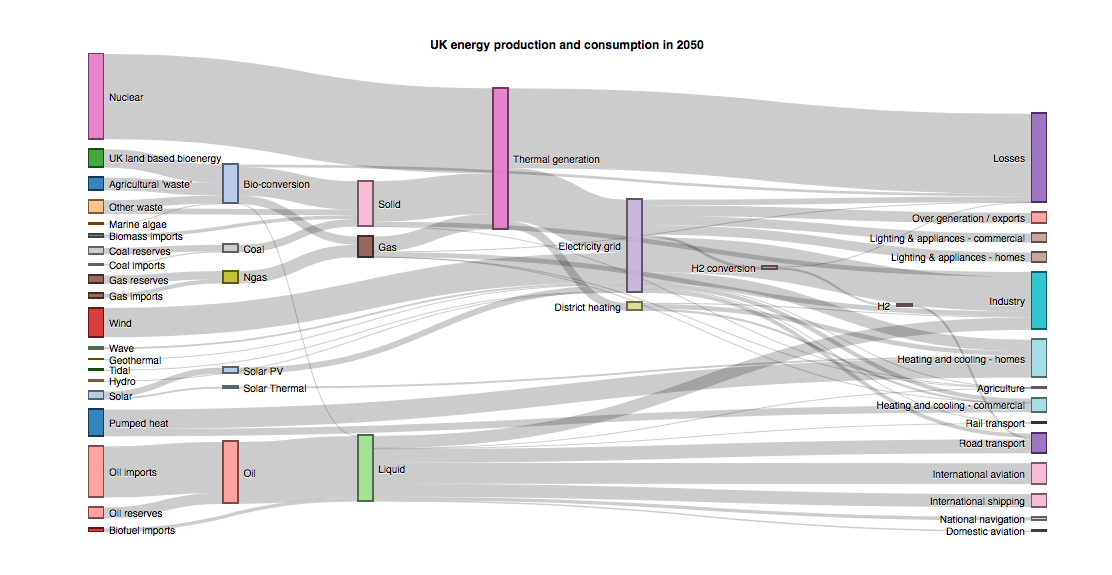
A Sankey diagram is a flow diagram where the width of the arrows is proportional to the flow quantity.
Use one of the following data selection patterns. In the first example, nodes are identified by name; in the second, they are identified by ID.
select source, target, value
from mydb.Data;

select source_id, source, target_id, target, value
from mydb.Data;
Sankey Diagram Example
select 'dbr.d3', 'sankey', 'UK energy production and consumption in 2050',960, 500;
select 'dbr.d3.sankey_format', ',.0f', ' Twh';

select source, target, value
from  demo_uk_energy;
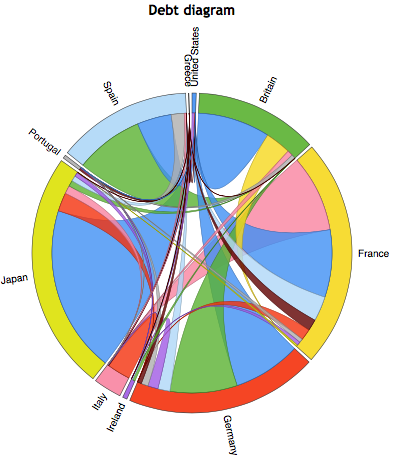
Chord Diagram
A Chord diagram visualizes the inter-relationships between data points in a matrix.
The data consists of connected nodes and their associated values:
select `to`, `from`, value
from mydb.Data;
Chord Diagram Example
select 'dbr.d3', 'chord', 'Debt diagram';


select creditor, debtor, value
from debts;