OpenStreetMap Extension
The OpenStreetMap extension lets you create OpenStreetMap mashups with ease. You can generate a report object containing an OpenStreetMap with markers placed on it, where each marker's info bubble can display your own data. Markers can be positioned using geographic coordinates (latitude and longitude) or a plain text address.
OpenStreetMap supports different tile servers as an alternative to its own default tiles.
myDBR uses the Leaflet JavaScript library as its interface to OpenStreetMap. For heatmaps, myDBR uses the Leaflet.heat plugin. Map markers can be customised with Leaflet custom icons and Leaflet.ExtraMarkers.
Commands
dbr.openstreetmap - Display the map
dbr.openstreetmap.options - Provide additional options to the Leaflet.js L.Map object
dbr.openstreetmap.heatmap - Enable the heatmap layer
dbr.openstreetmap.tiles - Use alternative tile layers on top of the map
dbr.openstreetmap.geojson - Include a GeoJSON file on the map
dbr.openstreetmap.polygon - Add polygons to the map.
Syntax
select 'dbr.openstreetmap', 'coordinates' | 'address' | 'coordinates_address' | osm_node {,title, width, height, zoom}
select 'dbr.openstreetmap.options', 'options'
select 'dbr.openstreetmap.heatmap', 1[, leafletheat_options]
select 'dbr.openstreetmap.tiles', tile_server_url [, tiles_options]
select 'dbr.openstreetmap.geojson', url_to_geojson_file [, geojson_options]
select 'dbr.openstreetmap.polygon', LatLng_array [, polyline_options]
Syntax Tips
Where:
-
leafletheat_options
Optional configuration for the Leaflet heatmap (e.g., "{radius: 25}").Property Description minOpacity The minimum opacity at which the heat starts. maxZoom The zoom level where points reach maximum intensity (intensity scales with zoom). Defaults to the map's maxZoom.max Maximum point intensity. Defaults to 1.0. radius Radius of each heatmap point. Defaults to 25. blur Amount of blur applied. Defaults to 15. gradient Color gradient configuration (e.g., {0.4: 'blue', 0.65: 'lime', 1: 'red'}). -
tiles_options
Optional settings required by the specific tile server. -
PointWeight
ThePointWeightobject allows you to specify a weight for a data point. Applying a weight causes the point to be rendered with greater intensity. The default weight is 1. -
bubble_options
These options define settings for Leaflet custom icons andLeaflet.ExtraMarkers.Property Description Default Value Possible Values extraClasses Additional CSS classes for the created <i>tag.''fa-rotate90 myclass;(space-delimited)icon Name of the icon, including the prefix. ''fa-coffee(refer to icon library documentation)iconColor Color of the icon. 'white''white','black', or CSS code (hex, rgba, etc.)innerHTML Custom HTML content. ''<svg>, images, or other HTML. A truthy value overrides default icon creation.markerColor Color of the marker (CSS class). 'blue''blue','red','orange-dark','orange','yellow','blue-dark','cyan','purple','violet','pink','green-dark','green','green-light','black', or'white'number Plain text to display instead of an icon. '''1','A', etc. (Must seticon: 'fa-number')prefix The icon library's base class. 'glyphicon''fa'(refer to icon library documentation)shape Shape of the marker (CSS class). 'circle''circle','square','star', or'penta'
Usage
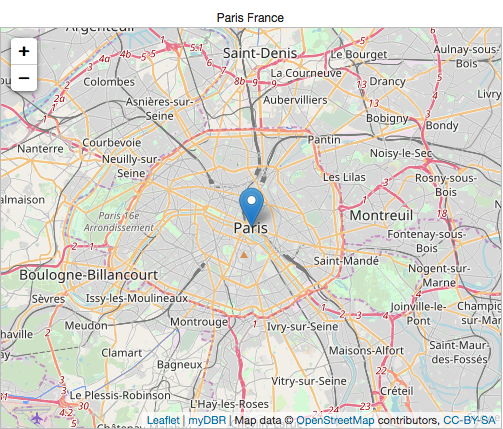
Example: Map Using an Address
/* Mashup based on address */
select 'dbr.openstreetmap', 'address';

select 'Paris', 'Paris, France';
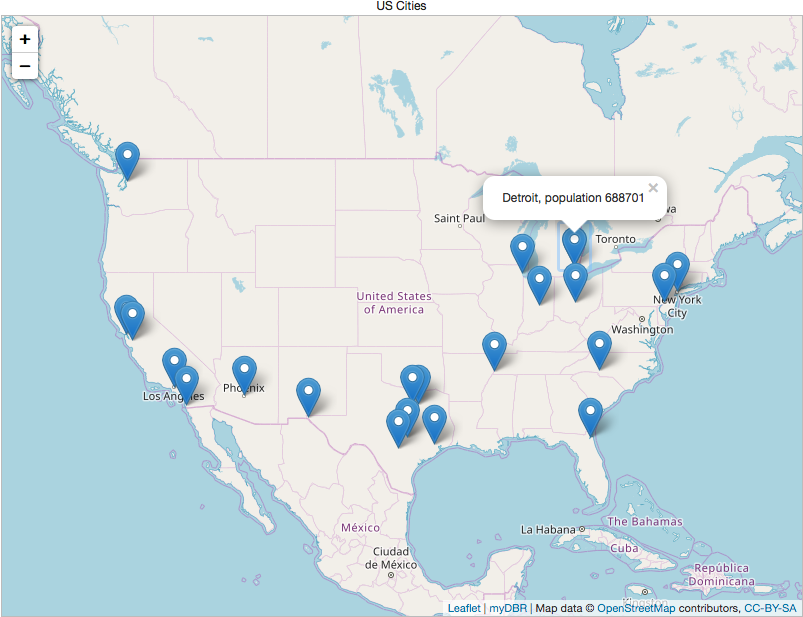
Example: Map Using Latitude and Longitude
/* Map based on coordinates */
select 'dbr.openstreetmap', 'coordinates';

select latitude, longitude, bubble_html
from mydb.cities;
Example: Mixing Coordinates and Addresses
You can combine latitude/longitude with addresses. If the latitude is null, myDBR will fall back to using the address for geocoding.
select 'dbr.openstreetmap', 'coordinates_address';

select null, null, 'Chicago', 'City of Chicago'
union
select 40.7127837,-74.0059413, null,  "New York";
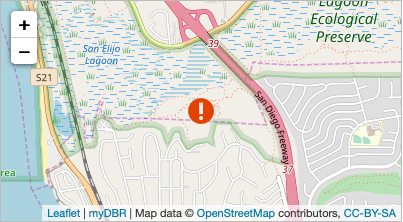
Customizing Markers
By using the iconUrl attribute, myDBR applies bubble_options as Leaflet icon attributes. For more details, see the Leaflet documentation for Markers with Custom Icons.
select 'dbr.openstreetmap', 'coordinates', '', 400, 220, 14;

select 33.005, -117.265, '', "{iconUrl: 'user/images/warning.gif', iconSize: [32, 32]}";
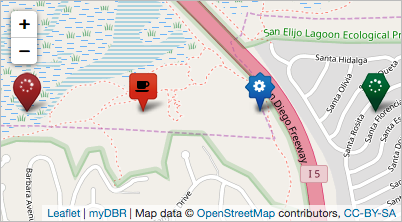
Adding FontAwesome Icons
You can use the FontAwesome icons included with myDBR for your markers:
select 'dbr.openstreetmap', 'coordinates', '', 400, 220;

select 33.005, -117.270, '', "{icon: 'fa-spinner',shape: 'circle',markerColor: 'red',prefix: 'fa',extraClasses: 'fa-spin'}"
union
select 33.005, -117.265, '', "{icon: 'fa-coffee',shape: 'square',markerColor: 'orange-dark',prefix: 'fa',iconColor: 'black'}"
union
select 33.005, -117.260, '', "{icon: 'fa-cog',shape: 'star',prefix: 'fa',markerColor: 'blue',iconColor: 'white'}"
union
select 33.005, -117.255, '', "{icon: 'fa-spinner',shape: 'penta',markerColor: 'green-dark',iconColor: 'white', prefix: 'fa'}"
;
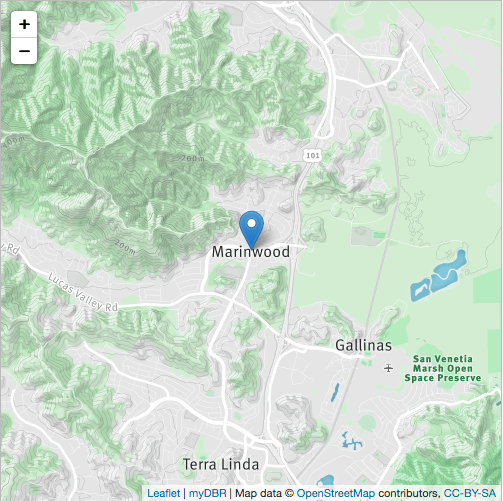
Using Different Tile Layers
OpenStreetMap allows you to use various tile layers. The following example uses a MapBox tile layer. To specify a tile layer, provide the URL to the dbr.openstreetmap.tiles command along with any necessary options. In this case, the run-bike-hike layer is selected by passing the "id:'mapbox.run-bike-hike'" option.
select 'dbr.openstreetmap', 'address', 'Marinwood run-bike-hike tile', 500, 500, 13;
select 'dbr.openstreetmap.tiles', 'https://api.tiles.mapbox.com/v4/{id}/{z}/{x}/{y}.png?access_token=pk.eyJ1IjoibWFwYm94IiwiYSI6ImNpejY4NXVycTA2emYycXBndHRqcmZ3N3gifQ.rJcFIG214AriISLbB6B5aw',
  "id:'mapbox.run-bike-hike'";

select 'Marinwood', 'Marinwood';
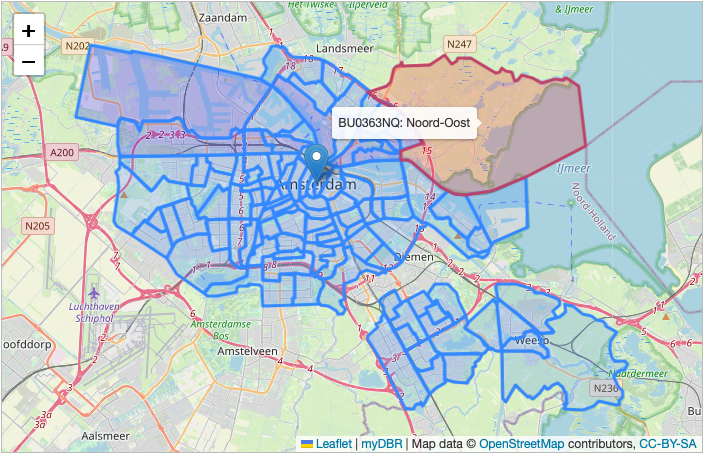
Embedding GeoJSON Files
You can extend the map's functionality by including GeoJSON files. Additional features can be controlled via GeoJSON options.
In this example, we use the onEachFeature functionality to invoke a function for every GeoJSON feature (representing neighborhoods in Amsterdam). We add hover effects and create a linked report for each feature using the properties defined in the GeoJSON file.
create procedure sp_DBR_amsterdam()
begin

select 'dbr.javascript', 'function onEachFeature(feature, layer) {
layer.bindTooltip(feature.properties.CBS_Wijkcode+": "+feature.properties.Gebied).openTooltip();

layer.on("mouseover", function () {
  this.setStyle({
    "fillColor": "#ff0000",
    "color" : "#BD4267"
  });
});
layer.on("mouseout", function () {
  this.setStyle({
    "fillColor": "#0000ff",
    "color" : "#3388ff"
  });
});
layer.on("click", function () {
  // Open report in a poup. Get the generic JS call and pass the Gebied to it
  // remove the preceding "javascript:" and add the CBS_Wijkcode as parameter
  // You can use browser debugger to see what is going on
  var url=$(".mapurl").attr("href").substr(11).replace("&e1=1", "&u1="+feature.properties.CBS_Wijkcode);
  eval(url);
});

}';

select 'dbr.openstreetmap', 'address', 'Amsterdam', 700, 450;
select 'dbr.openstreetmap.geojson', 'internal/amsterdam_wijk_lng_lat.json', '{onEachFeature:onEachFeature}';

select 'Amsterdam';

/* Generate an URL for the report link */
select 'dbr.report', 'sp_DBR_amsterdam_wijkcode', 'popup', 'inWijkcode<=1';
select 'dbr.button', '', 'hidden mapurl';

select 1;

end
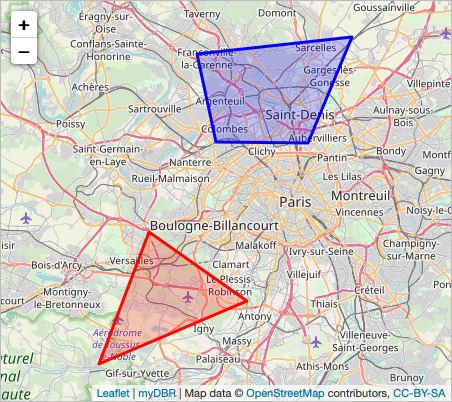
Adding Polygons
Polygons are rendered on top of existing map data (such as coordinates or heatmaps). If the map contains only polygons, use an empty result set for the coordinates.
select 'dbr.openstreetmap.polygon', latlngs, options
from (
select '[[48.829469, 2.150573],[48.767051, 2.285156], [48.709994, 2.081909]]' as latlngs, "{color: 'red'}" as options
union
select "[[48.990130, 2.216491],[49.005447, 2.429351],[48.909864, 2.368927],[48.910767, 2.242584]]", "{color: 'blue'}"
) as q;

select 'dbr.openstreetmap', 'coordinates','', 900, 500;

select 0, 0 limit 0;
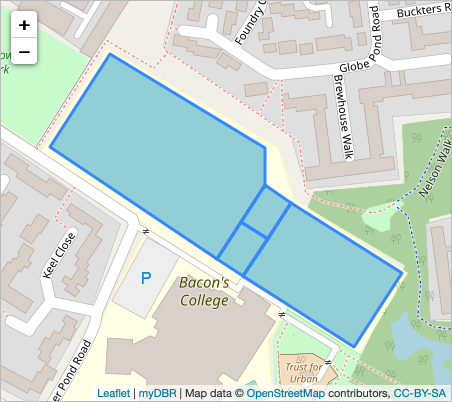
Polygons can also consist of multiple areas combined into a single object:
select 'dbr.openstreetmap.polygon',  '
[
  [
    [51.504465, -0.042298],
    [51.503831, -0.04063],
    [51.50359, -0.04063],
    [51.503096, -0.041145],
    [51.503844, -0.042942]
  ],
  [
    [51.50359, -0.04063],
    [51.503470, -0.040346],
    [51.503226, -0.040598],
    [51.50334, -0.040890]
  ],
  [
    [51.50334, -0.040890],
    [51.503226, -0.040598],
    [51.502979, -0.040862],
    [51.503096, -0.041145]
  ],
  [
    [51.503470, -0.040346],
    [51.502999, -0.03916],
    [51.502502, -0.039675],
    [51.502979, -0.040862]
  ]
]
';

select 'dbr.openstreetmap', 'coordinates','', 450, 400;

select 0, 0 limit 0;
Geocode Caching
To enhance performance, myDBR caches geocoding results (address-to-coordinate conversions) in the mydbr_geocode table. This feature can be disabled using the $mydbr_defaults['geocode']['cache'] option.