Google Maps Extension
The Google Maps extension lets you create Google Maps mashups with ease. You can generate a report object containing a Google Map with markers placed on it, where each marker's info bubble can display your own data. Markers can be positioned using geographic coordinates (latitude and longitude) or a plain text address.
Map attributes (size, center, and zoom level) can be controlled with parameters. If no attributes are specified, the map uses its default size, centers itself to fit all markers, and zooms automatically to keep them in view.
Commands
dbr.googlemaps - Display Google Maps mashup
dbr.googlemaps.link_in_title - Whether to show single linked report in the title or in the marker
dbr.googlemaps.polyline - Draw a polyline between the points
dbr.googlemaps.route - Draw route between the points
dbr.googlemaps.kml - Include KML-file into the maps
dbr.googlemaps.geojson - Include GeoJSON-file into the maps
dbr.googlemaps.marker - Add additional markers to map
dbr.googlemaps.same - Use the previous map and add elements to it instead of creating a new one
Syntax
select 'dbr.googlemaps', 'coordinates' | 'address' [, title [, width [, height [, lat [ , lng [, zoom [, map_type]]]]]]]
select 'dbr.googlemaps.link_in_title', 1
select 'dbr.googlemaps.polyline', color, width
select 'dbr.googlemaps.route', 'driving' | 'walking' | 'bicycling' | 'transit' | two_wheeler, [ hide_markers, [ avoid]]
select 'dbr.googlemaps.kml', url_to_kml_file
select 'dbr.googlemaps.geojson', url_to_geojson_file
select 'dbr.googlemaps.marker', lat | address [, lng [, bubble [, icon [, iconShadow [, markerLabel]]]]]
select 'dbr.googlemaps.marker', lat | address [, lng [, bubble [, icon [, iconShadow [, markerLabel]]]]]
Syntax Tips
Where:
-
lat, lng
The latitude and longitude of the map center. Use 0 to enable auto-centering. -
map_type
'roadmap', 'satellite', 'terrain' or 'hybrid' -
bubble
Options include:- marker-{Google Maps PinElement as JSON}
- svg-marker-background_color-glyph_color-border_color
- A predefined marker (see the options below).
- A URL to an accessible image.
- SVG image source <svg>...</svg>
-
marker/shadow
The optional 'marker' and 'shadow' parameters specify URLs for images to be displayed on the map. myDBR includes several preinstalled markers, but you can also use custom images. When using custom images, use the format 'URL:❌:y[::center]', wherexandyrepresent the image dimensions in pixels, and the optionalcenterparameter centers the marker. -
PointWeight
The PointWeight object allows you to specify a weight for a data point. Applying a weight causes the point to be rendered with greater intensity.
Google Maps API Key
The myDBR Google Maps extension utilizes the Google Maps API V3. When addresses are used, it performs server-side geocoding. If you have a Google Maps API key, you can configure it by adding the following line to your configuration:
$mydbr_defaults['google_maps_api_key']='YOUR_API_KEY';
Usage
/* Mashup based on address */
select 'dbr.googlemaps', 'address';

select address, bubble_html
from mydb.data;

/* Mashup based on coordinates */
select 'dbr.googlemaps', 'coordinates';

select latitude, longitude, bubble_html
from mydb.data;
Explanation
This command generates a Google Maps mashup, including the map, markers, and informational bubbles. It supports two input variations: coordinates (latitude and longitude) or address-based marker placement.
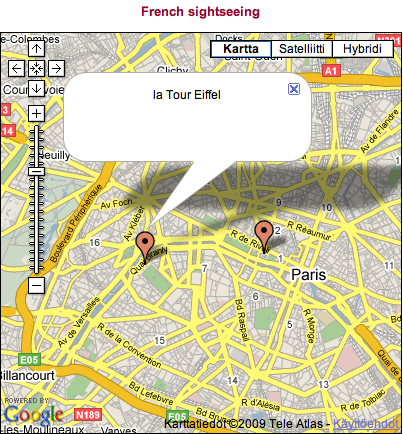
Example - Coordinates
This report places markers on a map based on their latitude and longitude.
/* We'll zoom the map to Paris */

select 'dbr.googlemaps', 'coordinates', 'French sightseeing', 400, 400;

select 48.858863, 2.294362, 'la Tour Eiffel'
union
select 48.861397, 2.335432, 'Musee du Louvre';
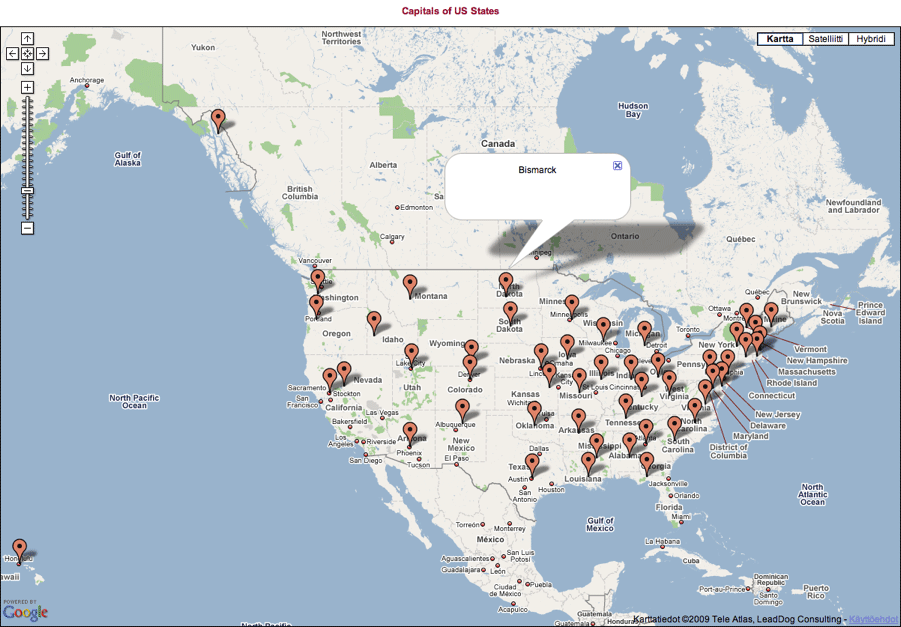
Example - Address
This report places markers on a map based on their address. Google Maps handles addresses flexibly, allowing you to use specific names or locations. This approach produces results similar to the coordinates example. The first column serves as the search criteria, and the second column provides the content for the informational bubbles.
/* Center to US */
select 'dbr.googlemaps', 'address', 'Capitals of US States', 1200, 800;

select concat(state, ',', capital), capital
from mydb.us_states;
Using Preinstalled Markers
myDBR includes a variety of preinstalled markers.
The following table lists the available markers and their corresponding URLs. When using preinstalled markers, myDBR automatically handles the sizing and applies the appropriate shadow.
| Plain | URL | Dot | URL | Pushpin | URL |
|---|---|---|---|---|---|
| blue | blue-dot | blue-pushpin | |||
| green | green-dot | grn-pushpin | |||
| pink | pink-dot | pink-pushpin | |||
| purple | purple-dot | purple-pushpin | |||
| red | red-dot | red-pushpin | |||
| yellow | yellow-dot | ylw-pushpin | |||
| orange | orange-dot | PinElement as JSON |
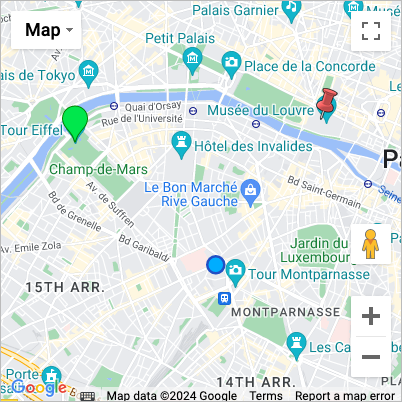
Example Usage of Custom Markers
select 'dbr.googlemaps', 'address', 'French sightseeing', 400, 400;

select 'la Tour Eiffel', 'la Tour Eiffel', 'green'
union
select 'Musee du Louvre', 'Musee du Louvre', 'red-pushpin';
union
select 'Musee Bourdelle, Paris', 'Musee Bourdelle', '<svg....>'
Additional Markers
You can also use custom images as markers. To do so, provide the image URL and, optionally, the desired dimensions using the '::width::height' notation at the end of the URL.
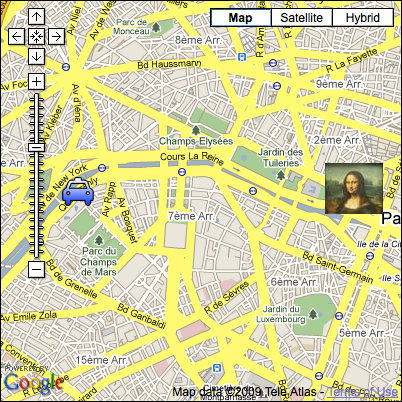
Example: Using Custom Markers
select 'dbr.googlemaps', 'address', 'French sightseeing', 400, 400;

select 'la Tour Eiffel', 'la Tour Eiffel', 'http://maps.google.com/mapfiles/ms/micons/cabs.png::32::32'
union
select 'Musee du Louvre', 'Musee du Louvre', '/myimages/monalisa.jpg::58::51';
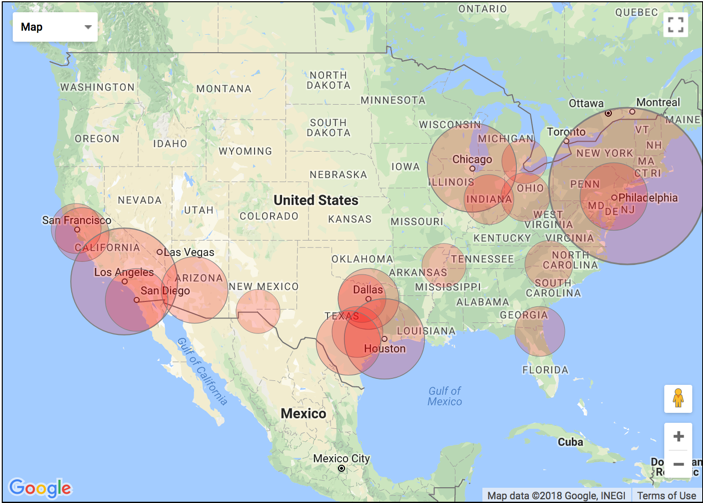
Using Custom SVG Marker
You can use custom SVG markers in Google Maps by specifying an SVG image as a marker parameter.
SVG Marker
Define the SVG image you wish to use as a marker:
<?xml version="1.0" encoding="UTF-8" standalone="no"?>
<svg xmlns="http://www.w3.org/2000/svg" width="100" height="100">
<circle cx="50" cy="50" r="49" fill="red" fill-opacity="0.2" stroke="gray" stroke-width="1"/>
</svg>
select 'dbr.parameters.show';
select 'dbr.googlemaps', 'coordinates', 'Biggest cities in US', 700, 500;

select latitude, longitude, name, f_map_city_size(''user/images/circle.svg', population), '','', population
from us_cities
order by population desc;
In this example, the f_map_city_size function returns the SVG image size in pixels relative to the population. For instance: user/images/circle.svg::160::160::center.
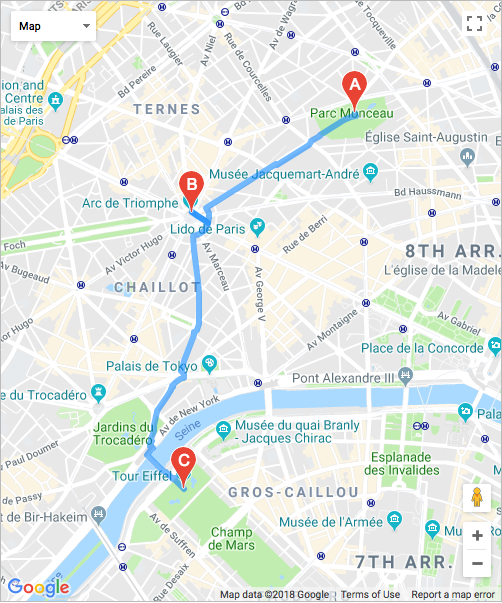
Routes
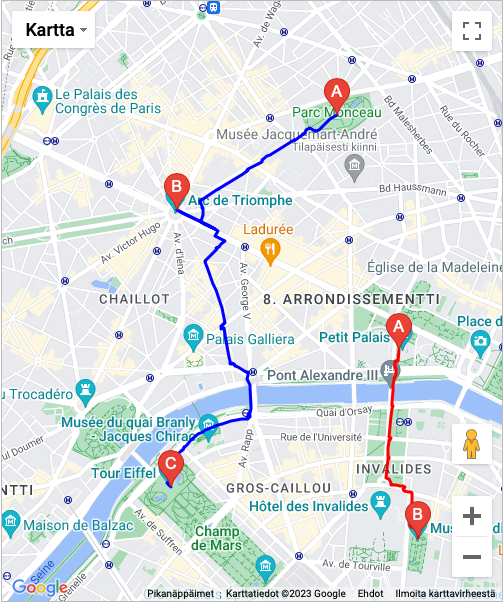
The route option enables path planning between points. By adding a color column as the final column in your query, you can define the route's color and display multiple routes simultaneously. The avoid parameter accepts a comma-separated string to specify features to avoid (e.g., 'ferries, highways, tolls').
select 'dbr.googlemaps', 'address', '', 500, 600;
select 'dbr.googlemaps.route', 'walking';

select 'Parc Monceau, Paris'
union
select 'Arc de Triomphe'
union
select 'Eiffel tower';
select 'dbr.googlemaps', 'address', '', 500, 600;
select 'dbr.googlemaps.route', 'walking';

select 'Parc Monceau, Paris', 'blue'
union
select 'Arc de Triomphe', 'blue'
union
select 'Eiffel tower', 'blue'
union
select 'Petit Palais', 'red'
union
select 'Musée Rodin', 'red';
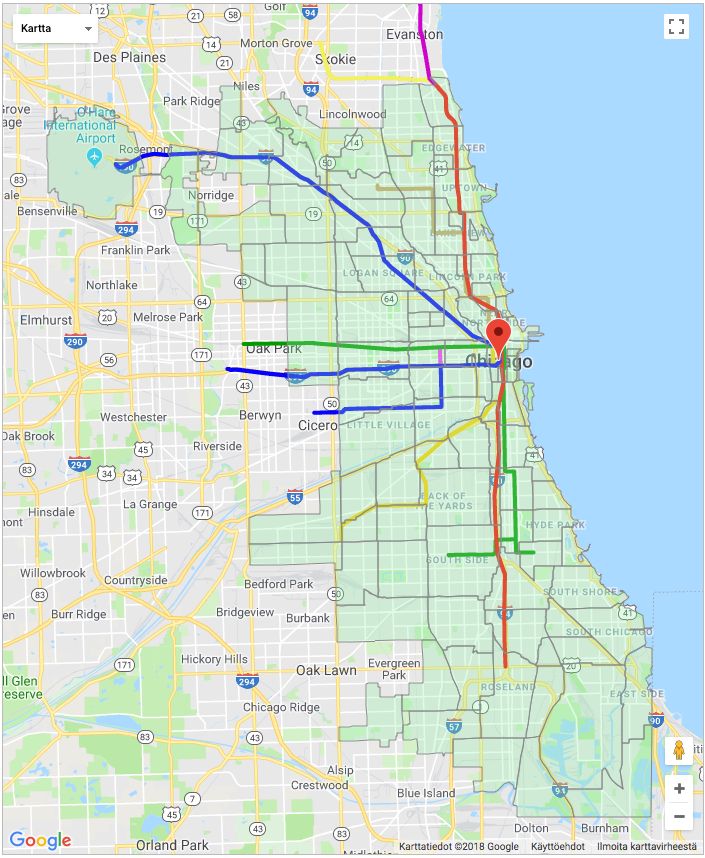
Including KML and GeoJSON Files and Extending Map Functionality
You can include KML and GeoJSON files on the map and access the Google Maps API within your report to further extend its functionality.
The Google_map.get_map_object function retrieves the Google Maps object, using the resultclass as its parameter.
Show Chicago Transit Map
select 'dbr.resultclass', 'sample_map';
select 'dbr.googlemaps', 'coordinates', '', 700, 850, 0, 0, 9;
select 'dbr.googlemaps.kml', 'http://googlemaps.github.io/js-v2-samples/ggeoxml/cta.kml';
select 'dbr.googlemaps.geojson', 'user/chicago.geojson';

select 'Chicago';

select 'dbr.javascript', "Google_map.get_map_object('sample_map').data.setStyle([fillColor: '#94F2AC',strokeColor:'#888' ,strokeWeight: 1});";
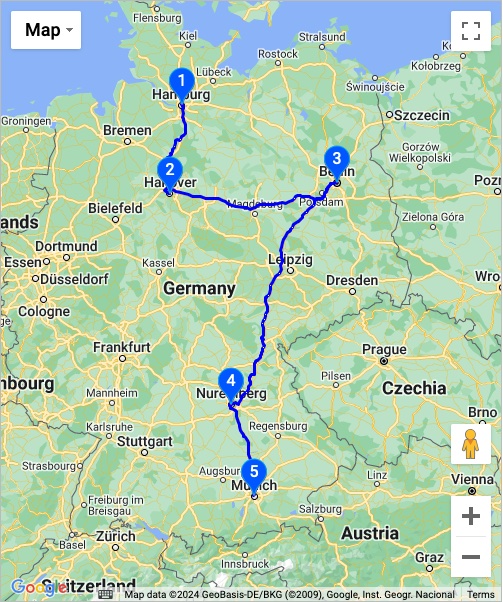
Adding Multiple Result Sets to a Single Map
By using the dbr.googlemaps.same command, subsequent map data is added to the current map instead of creating a new one. In the following example, a route is first plotted without markers, and then custom markers are added to that same map:
create temporary table stops
as
select 'Hamburg' as 'name', 1 as label
union
select 'Hannover', 2
union
select 'Berlin', 3
union
select 'Nürnberg', 4
union
select 'München', 5;

select 'dbr.googlemaps', 'address', '', 500, 600;
select 'dbr.googlemaps.route', 'driving', 0;

select name
from stops
order by label;

/* Add elements to the previuous map */
select 'dbr.googlemaps.same', 1;
select 'dbr.googlemaps', 'address', '', 500, 600;

select name, name, 'svg-marker-#0056FF-#FFFFFF-#00AAFF', '', label
from stops
order by label;
Extending the Map with Custom Elements
You can extend the map with custom elements by defining a JavaScript function named googleMapsExtend. myDBR calls this function with two parameters: map (the map object) and index (the map's index if multiple maps are displayed on a single page):
select 'dbr.javascript', 'function googleMapsExtend(map, idx) {
  if (idx!=1) return;
  const flightPlanCoordinates = [
    { lat: 37.772, lng: -122.214 },
    { lat: 21.291, lng: -157.821 },
    { lat: -18.142, lng: 178.431 },
    { lat: -27.467, lng: 153.027 },
  ];
  const flightPath = new google.maps.Polyline({
    path: flightPlanCoordinates,
    geodesic: true,
    strokeColor: "#FF0000",
    strokeOpacity: 1.0,
    strokeWeight: 2,
  });

  flightPath.setMap(map);
}';
Geocode Caching
myDBR caches geocoding results (address-to-coordinate conversions) in the mydbr_geocode table. This feature can be disabled using the $mydbr_defaults['geocode']['cache'] option.