eChart Extension
The eChart extension is a skeleton extension that enables the use of additional chart types in ChartDirector, providing Bubble and Radar charts as examples. Full source code is included. Because the extension resides in the user directory, any modifications made to it are preserved across myDBR updates.
Commands
dbr.echart - Creates an extended chart
dbr.echart.color - Specifies the color palette for the chart
dbr.echart.name - Sets the names for the chart categories
dbr.echart.bubble_scale - Scales the bubble chart axes
Syntax
select 'dbr.echart', 'radar' | 'bubble'
select 'dbr.echart.color', 'ARGB color1', 'ARGB color2'...
select 'dbr.echart.color', 'Category 1', 'Category 2'...
select 'dbr.echart.bubble_scale',1
Usage
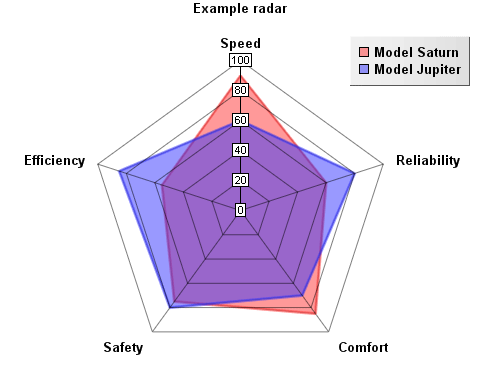
Creating a Radar Chart
select 'dbr.echart', 'radar', 'Example radar';
select 'dbr.echart.color', '0x80ff3333', '0x803333ff';
select 'dbr.echart.name', 'Model Saturn', 'Model Jupiter';

select Speed, Reliability, Comfort, Safety, Efficiency
from radar_data;
Creating a Bubble Chart
By default, bubble sizes (z) are specified in pixels because the axes are automatically scaled and can represent various data types. To use absolute scaling where bubble sizes are relative to the axes, use the dbr.echart.bubble_scale command.
select 'dbr.echart', 'bubble', 'Bubble chart';
select 'dbr.echart.color', '0x80ff3333', '0x803333ff','0x80FF33ff';

select x, y, z, category
from bubble_data;
